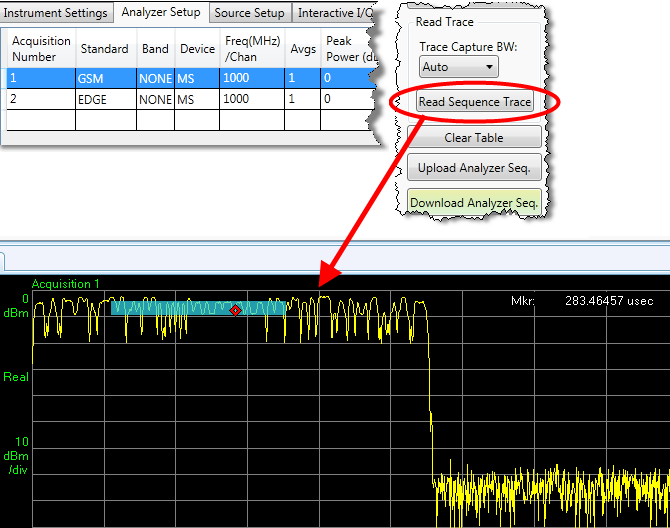
Click Read Sequence Trace to display a waveform trace (captured by the test set's analyzer) in the Graph window. This causes the current sequence to be executed once; a trace is captured for each acquisition. (Highlight the acquisition row in the Analyzer Setup table, to see the trace for that acquisition.) The analysis intervals for the acquisition (represented by blue bars in the graph) can easily moved and stretched vertically and horizontally on the graph, to align them with the portion of the signal that is to be measured.
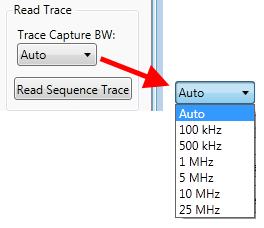
The Trace Capture Bandwidth can be specified by selecting one of the values from the dropdown list. However, as the trace data is used only for the purpose of representing the trace visually, the capture bandwidth is usually not critical. In most situations, it is best to leave the setting as Auto, and let Sequence Studio choose a bandwidth value. The value chosen when you select Auto is dependent on the measurement mode (for example, 1.23 MHz in the case of cdma2000, but 7.68 MHz for W-CDMA).
Note: Choosing a wider bandwidth than necessary can slow down operation when a sequence is run in continuous mode, because too many samples are being captured while the sequence is running.
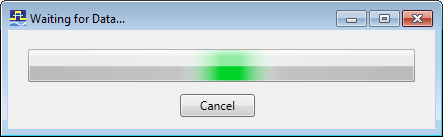
In some cases the sequence trace cannot be read immediately, because the sequence is not triggered immediately (for example,if the sequencer is waiting for the DUT to start transmitting). If the sequence is not triggered within 2 seconds after you have clicked Read Sequence Trace, a "Waiting for Data" window appears, and remains open until the sequence is triggered or the Cancel button is clicked.